Thursday, November 9, 2017

Visualising protein interactions in UniProt


The UniProtKB entries include an Interaction section, which details the protein’s binary interactions with other proteins, using a high-quality dataset supplied by the IMEx Consortium.

You can now view the binary interactions in a graph that shows the interaction partners of your protein and also shows which of those partners interact with each other. For example, here is the interaction matrix for the human E3 ubiquitin-protein ligase parkin protein.


Dots dots dots

Each interaction edge is represented by a dot, of which the intensity represents the number of experiments supporting the interaction. Hovering over the dot highlights both partners.


Information on click

Clicking on an interaction dot brings up a popup window with details about the interaction.


This window contains more information about the interacting partners:

  • Names
  • Identifiers and link to UniProt entry
  • List of diseases, and link to the relevant section of the UniProt entry
  • Subcellular location
  • Number of experiments, and link to IntAct

Filtering the display

We currently have two filters which allow users to filter out data from the graph. They apply if any of the partners in the interaction satisfy the selected criteria.

The two filters are:

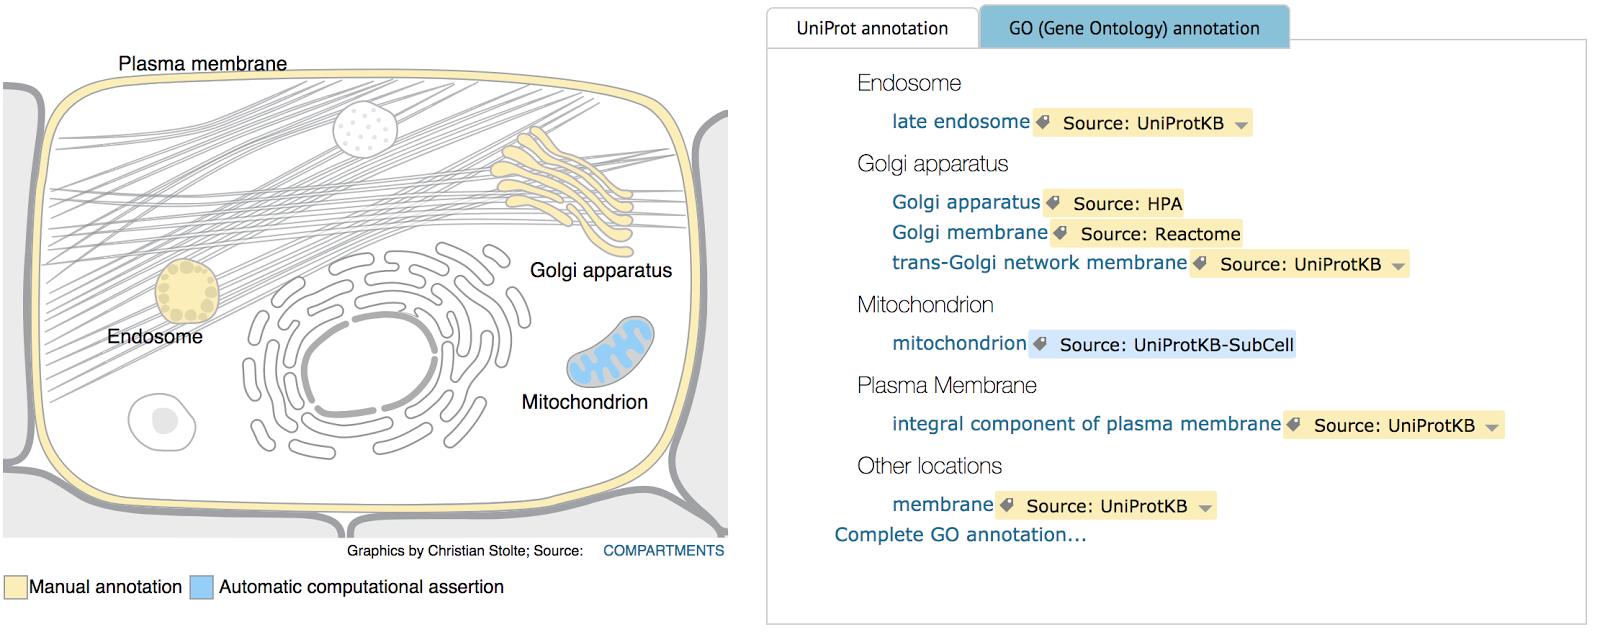
  • Subcellular location: this is a tree-based selection menu which allows users to filter proteins based on their location within the cell
  • Disease: only show proteins which are involved in the specified disease(s)
We are working on enhancing this view further. Are there any more filters or other improvements that you would like to suggest? Let us know!


Wednesday, November 1, 2017

Visualising sub-cellular locations in UniProt

The UniProt Knowledgebase provides protein entries covering key aspects of protein biology divided into sections that group related information.

One of the sections on the protein entry pages is Subcellular Location. This section provides information on the location and the topology of the mature protein in the cell. You can now visually explore the subcellular location in UniProtKB entries. The visualisation presents image templates from COMPARTMENTS https://compartments.jensenlab.org/ combined with protein location data from UniProt (expert annotation, rule-based automatic annotation) and imported from Gene Ontology (GO) annotation. The figure below shows the subcellular location view from the Human Copper-transporting ATPase 2 protein.


Colour-coded by evidence

The subcellular locations in which the protein is found are shown using colours and titles for the compartments. The colours can be gold which indicates 'Manual annotation' and blue which indicates 'Automatic computational assertion'. These colours are also reflected in the clickable evidence tags on the right hand side in the tabs showing the text annotation.

Source-based annotation tabs

There are two tabs based on the sources of annotation, one for UniProt annotation and one for GO (Gene Ontology) annotation. You can click on the tabs to view the specific annotation from that source. The image on the left hand side will update to reflect the annotation tab that you are on.


Click to highlight

You can also click on a coloured subcellular location compartment to quickly highlight the corresponding annotation on the right hand side. 

Try it out and let us know what you think! What else would you like to see visually in the UniProtKB entry?